South America
Brazil

Passport Bro score
Country Visuals
Nightlife · Food · City · Beaches
 Nightlife
 Food & Cafes
 City & Streets
 Beaches & Nature
How Women Look
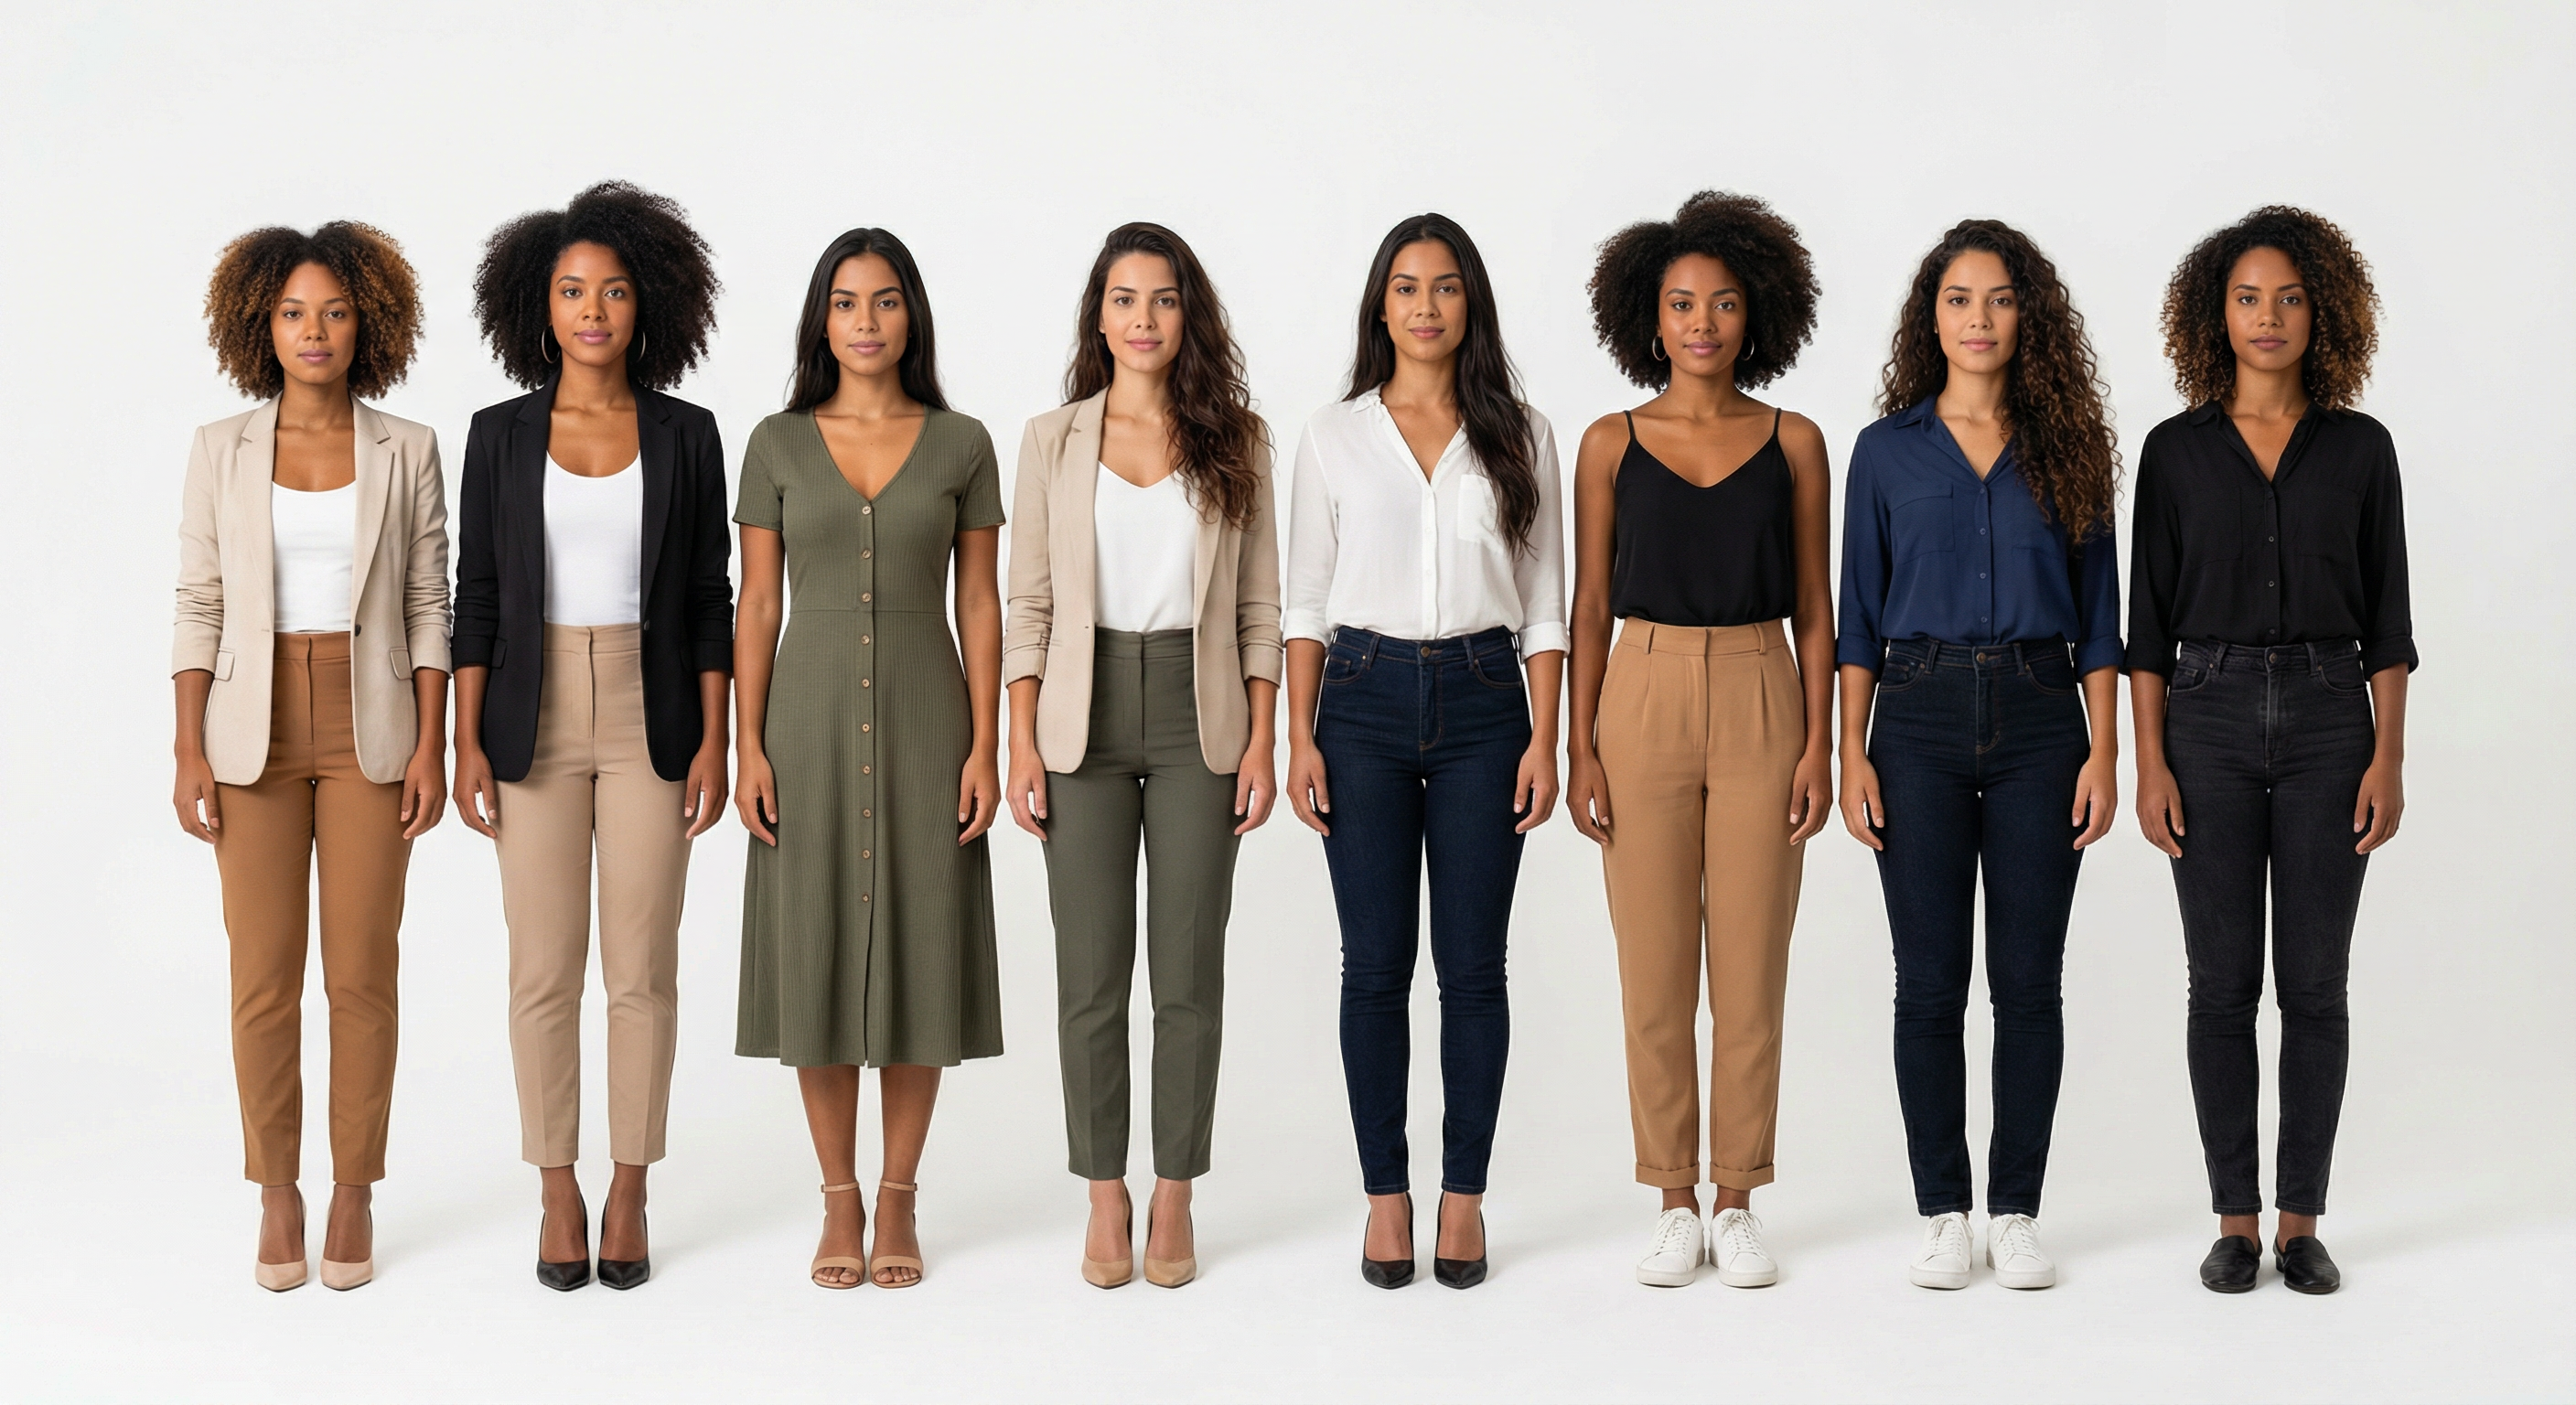
Typical look · 8 women, same format (AI generated)
Temperature Range
Peak Rainfall
197 mm/month
Best Months
AQI Reference Scale (US EPA Standard)
Florianopolis
Beach island city
Salvador
Cultural hub
Rio de Janeiro
Coastal metropolis
Manaus
Amazon gateway — seasonal fires
Sao Paulo
Largest city — urban smog
Annual median AQI — IQAir / WHO data. Based on US EPA standard scale.
Internet: Median Fixed Broadband — Speedtest Global Index
Pros7
- The absolute best for partying and vibes
- Exotic women who love to live life.
- Rio and São Paulo have legendary nightlife and dating scene.
Cons7
- High crime
- Many women actually prefer local men and aren't specifically looking for white/foreign guys.
- Safety is a real concern; robbery and violence in some areas.
Stats & Comparisons
Population · Economy · Physical · Society — switch tabs to explore
% of total population per age group · UN WPP
Ratio: more ♀ than ♂ in an age group is favorable; more ♂ than ♀ is unfavorable (severity shown).
Best & worst cities (20–39 prime age)
Cities with the best and worst female-to-male ratio in the prime dating window (ages 20–39). More women = larger dating pool and better competitive edge. Map: circle size = population; color = ratio.
Cities (20–39 prime age) · ratio & population
UN WPPRatio from country demographics (UN WPP) + city type. Population: UN / national statistics.
All cities (8) — sorted by ratio (best first)
Best: Salvador (109 ♀/100♂)Worst: Brasília (93 ♀/100♂)