North Africa
Egypt

Passport Bro score
Country Visuals
Nightlife · Food · City · Beaches
 Nightlife
 Food & Cafes
 City & Streets
 Beaches & Nature
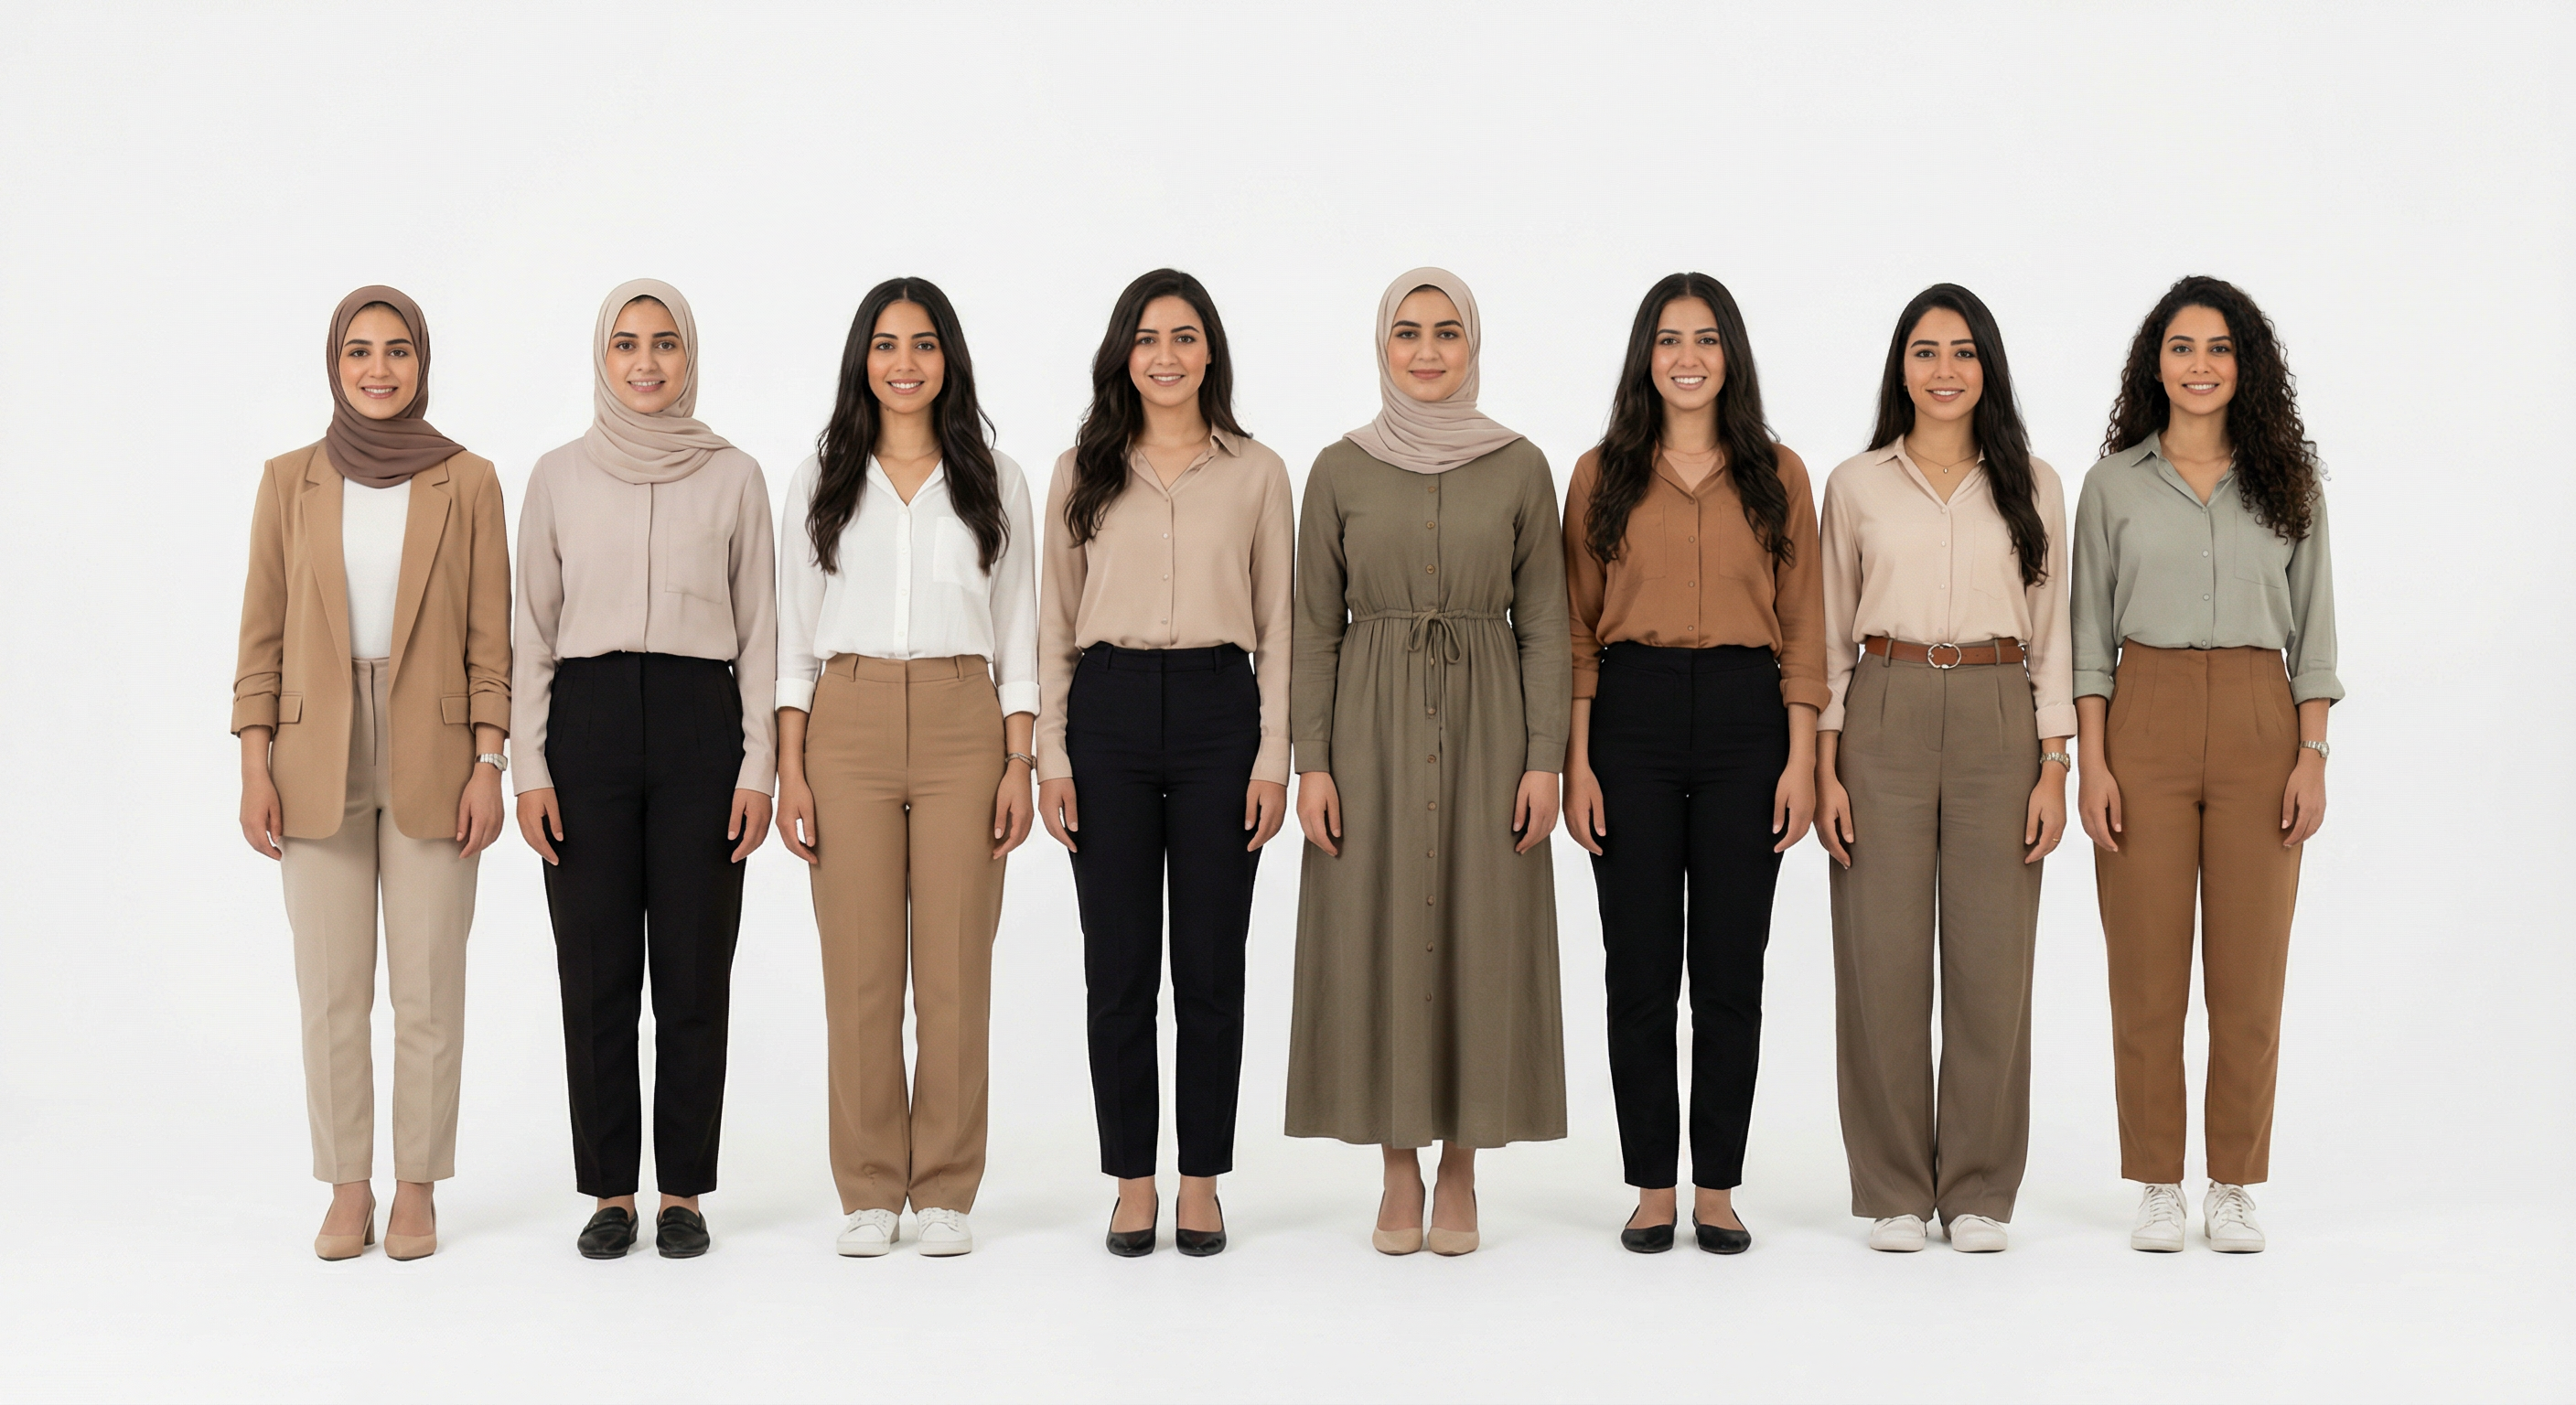
How Women Look
Typical look · 8 women, same format (AI generated)
Temperature Range
Peak Rainfall
6 mm/month
Best Months
AQI Reference Scale (US EPA Standard)
Sharm el-Sheikh
Red Sea resort
Hurghada
Diving hub
Alexandria
Mediterranean coast
Luxor
Valley of Kings
Cairo
Capital — desert dust + traffic
Annual median AQI — IQAir / WHO data. Based on US EPA standard scale.
Internet: Median Fixed Broadband — Speedtest Global Index
Pros3
- Historical sights.
- Historical sites; Red Sea resorts; affordable.
- Visa on arrival or e-visa for many.
Cons4
- Scammy, hectic, and conservative Muslim culture blocks dating.
- Harassment and hustling; women travelers report issues.
- Dating culture very different; conservative.
Stats & Comparisons
Population · Economy · Physical · Society — switch tabs to explore
% of total population per age group · UN WPP
Ratio: more ♀ than ♂ in an age group is favorable; more ♂ than ♀ is unfavorable (severity shown).
Best & worst cities (20–39 prime age)
Cities with the best and worst female-to-male ratio in the prime dating window (ages 20–39). More women = larger dating pool and better competitive edge. Map: circle size = population; color = ratio.
Cities (20–39 prime age) · ratio & population
UN WPPRatio from country demographics (UN WPP) + city type. Population: UN / national statistics.
All cities (4) — sorted by ratio (best first)
Best: Alexandria (100 ♀/100♂)Worst: Sharm El Sheikh (86 ♀/100♂)