Africa
Ethiopia
Passport Bro score
Country Visuals
Nightlife · Food · City · Beaches
 Nightlife
 Food & Cafes
 City & Streets
 Beaches & Nature
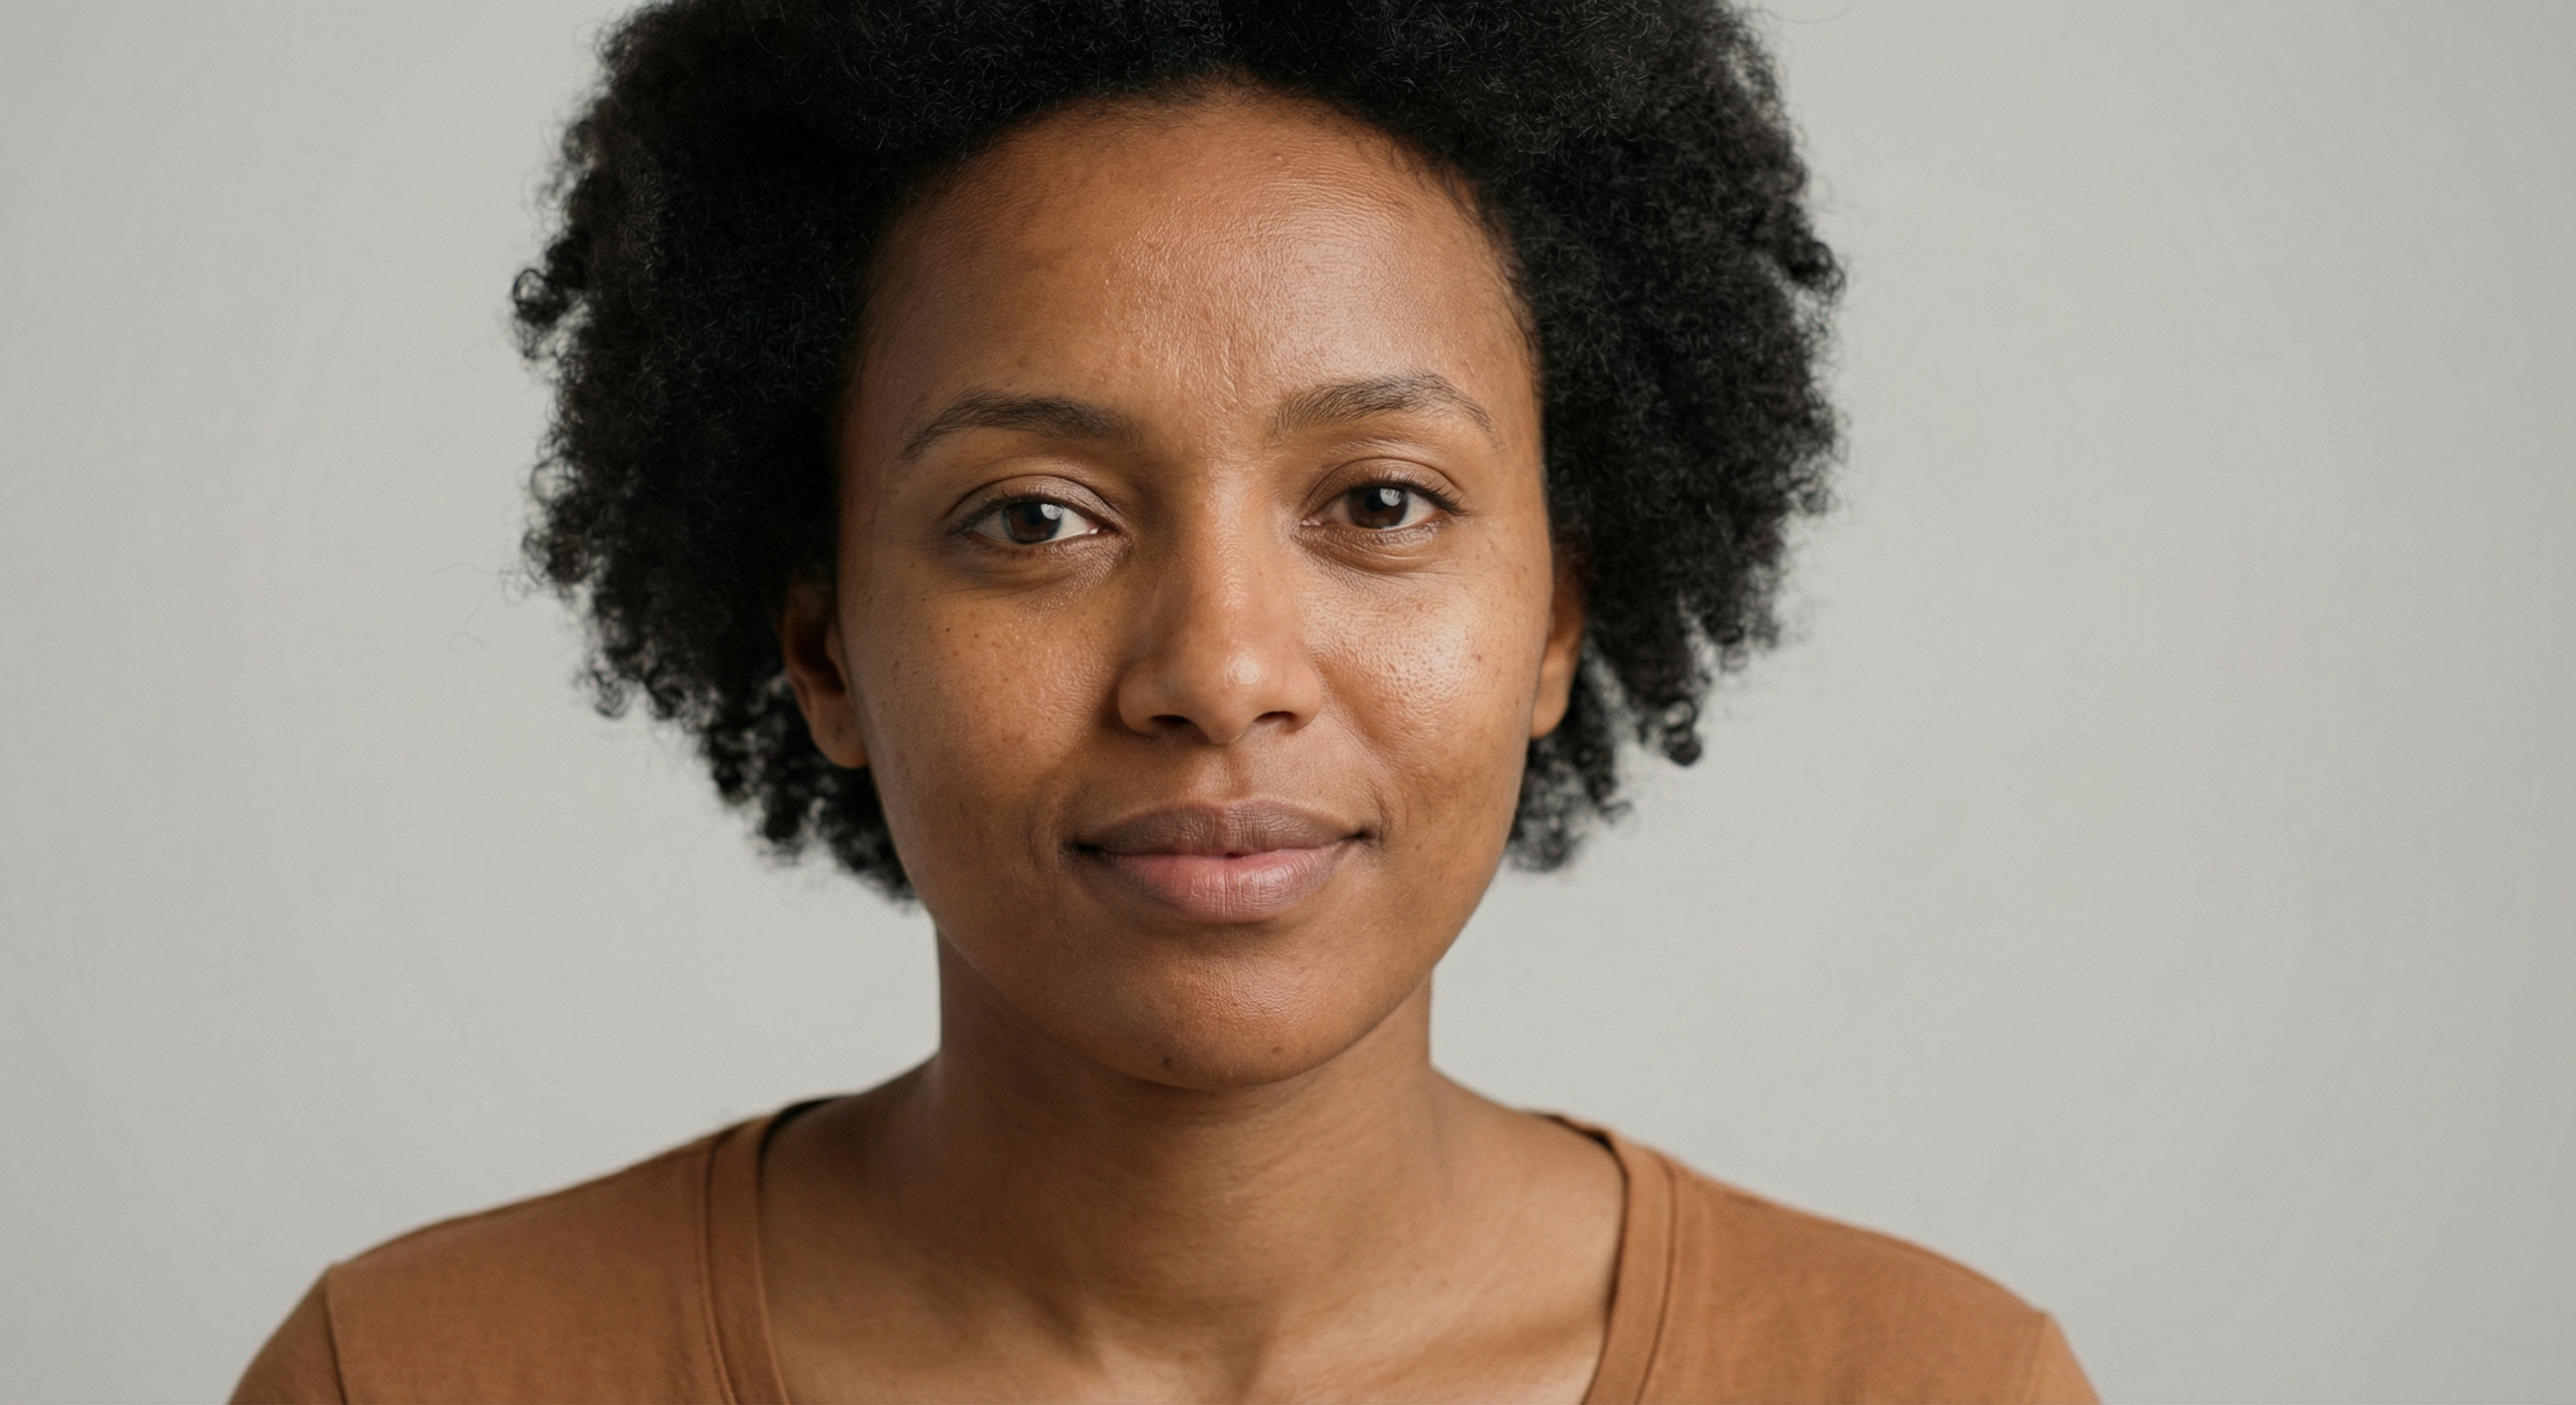
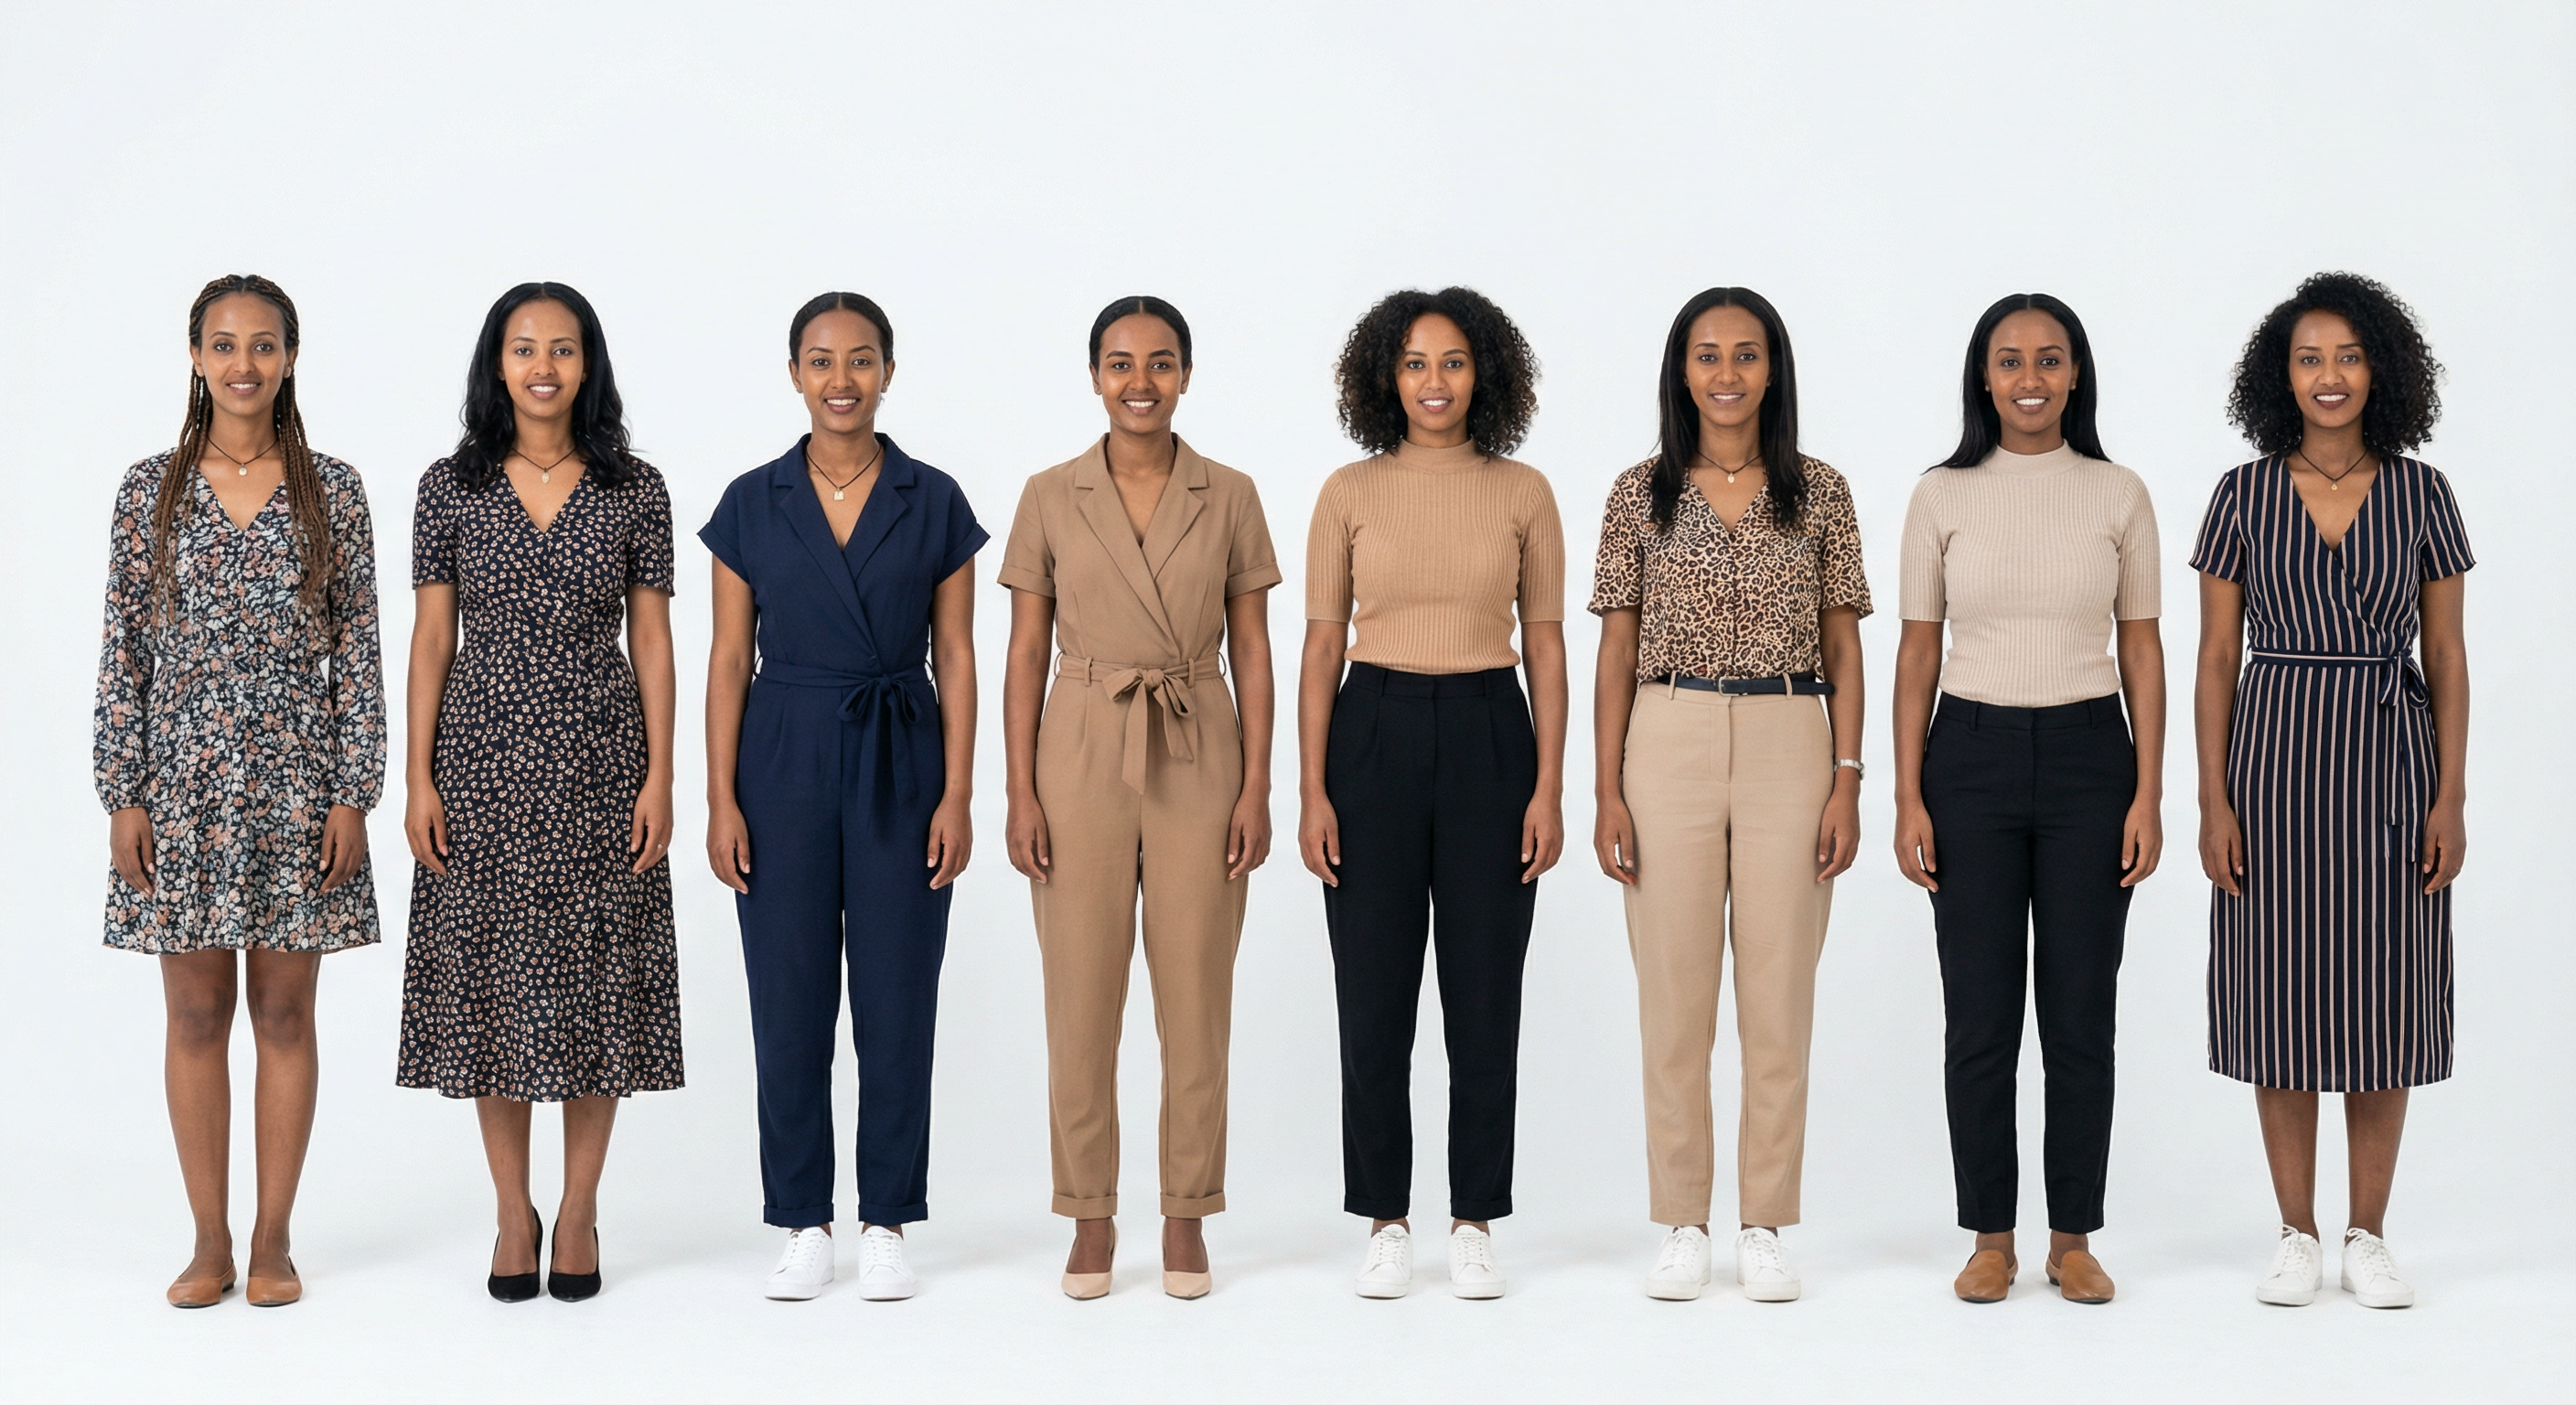
How Women Look
Typical look · 8 women, same format (AI generated)
Temperature Range
Peak Rainfall
165 mm/month
Best Months
AQI Reference Scale (US EPA Standard)
Lalibela
Historic churches
Gondar
Historical city
Addis Ababa
Capital
Annual median AQI — IQAir / WHO data. Based on US EPA standard scale.
Pros3
- Some of the most uniquely beautiful women on the continent
- Rich culture.
- Addis Ababa; unique culture; visa on arrival.
Cons2
- Political instability and conflict in certain regions make it risky.
- Infrastructure and safety; conservative in many areas.
Stats & Comparisons
Population · Economy · Physical · Society — switch tabs to explore
% of total population per age group · UN WPP
Ratio: more ♀ than ♂ in an age group is favorable; more ♂ than ♀ is unfavorable (severity shown).
Best & worst cities (20–39 prime age)
Cities with the best and worst female-to-male ratio in the prime dating window (ages 20–39). More women = larger dating pool and better competitive edge. Map: circle size = population; color = ratio.
Cities (20–39 prime age) · ratio & population
UN WPPRatio from country demographics (UN WPP) + city type. Population: UN / national statistics.
All cities (3) — sorted by ratio (best first)
Best: Addis Ababa (106 ♀/100♂)Worst: Dire Dawa (90 ♀/100♂)