Middle East
Iran

Passport Bro score
Country Visuals
Nightlife · Food · City · Beaches
 Nightlife
 Food & Cafes
 City & Streets
 Beaches & Nature
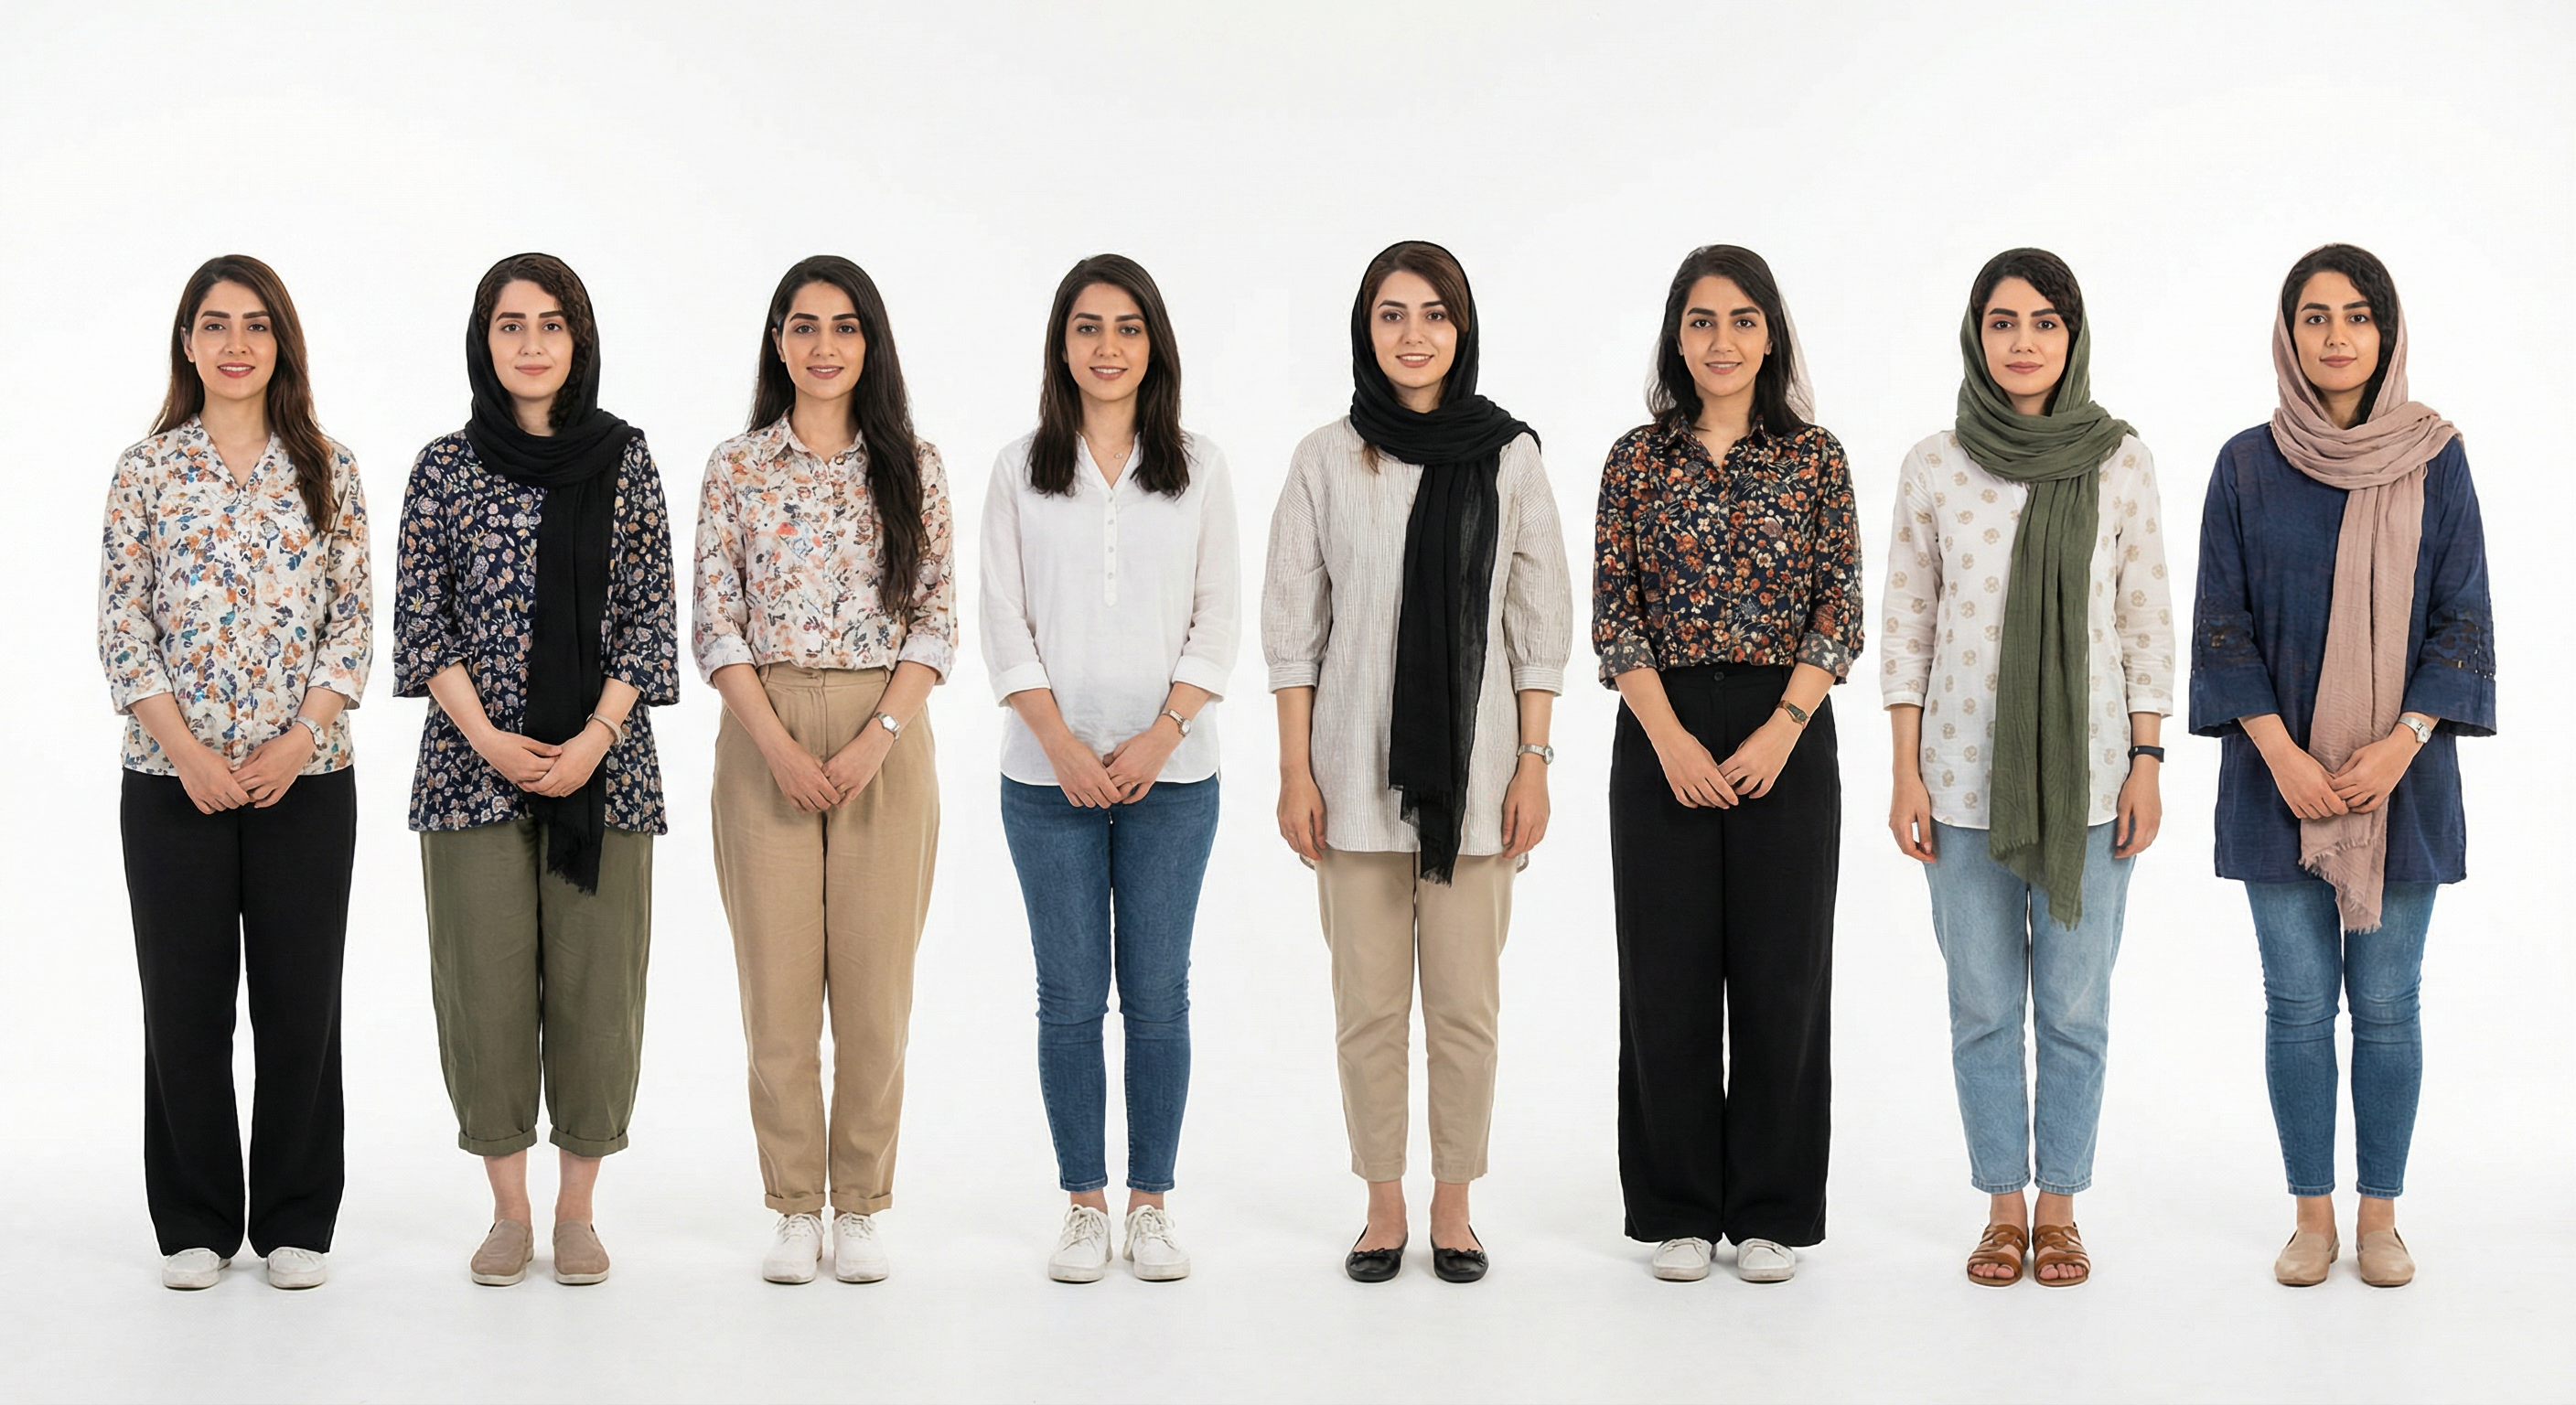
How Women Look
Typical look · 8 women, same format (AI generated)
Temperature Range
Peak Rainfall
84 mm/month
Best Months
AQI Reference Scale (US EPA Standard)
Shiraz
Cultural hub
Isfahan
Historic city
Mashhad
Pilgrimage city
Tehran
Capital — basin traps smog
Annual median AQI — IQAir / WHO data. Based on US EPA standard scale.
Internet: Median Fixed Broadband — Speedtest Global Index
Pros2
- Iranian women are famously gorgeous.
- Rich culture and history; hospitable people.
Cons4
- Extremely dangerous for Westerners
- Severe religious policing.
- Conservative; no dating scene for foreigners in that sense.
Stats & Comparisons
Population · Economy · Physical · Society — switch tabs to explore
% of total population per age group · UN WPP
Ratio: more ♀ than ♂ in an age group is favorable; more ♂ than ♀ is unfavorable (severity shown).
Best & worst cities (20–39 prime age)
Cities with the best and worst female-to-male ratio in the prime dating window (ages 20–39). More women = larger dating pool and better competitive edge. Map: circle size = population; color = ratio.
Cities (20–39 prime age) · ratio & population
UN WPPRatio from country demographics (UN WPP) + city type. Population: UN / national statistics.
All cities (4) — sorted by ratio (best first)
Best: Shiraz (107 ♀/100♂)Worst: Tehran (91 ♀/100♂)