Europe
Poland

Passport Bro score
Country Visuals
Nightlife · Food · City · Beaches
 Nightlife
 Food & Cafes
 City & Streets
 Beaches & Nature
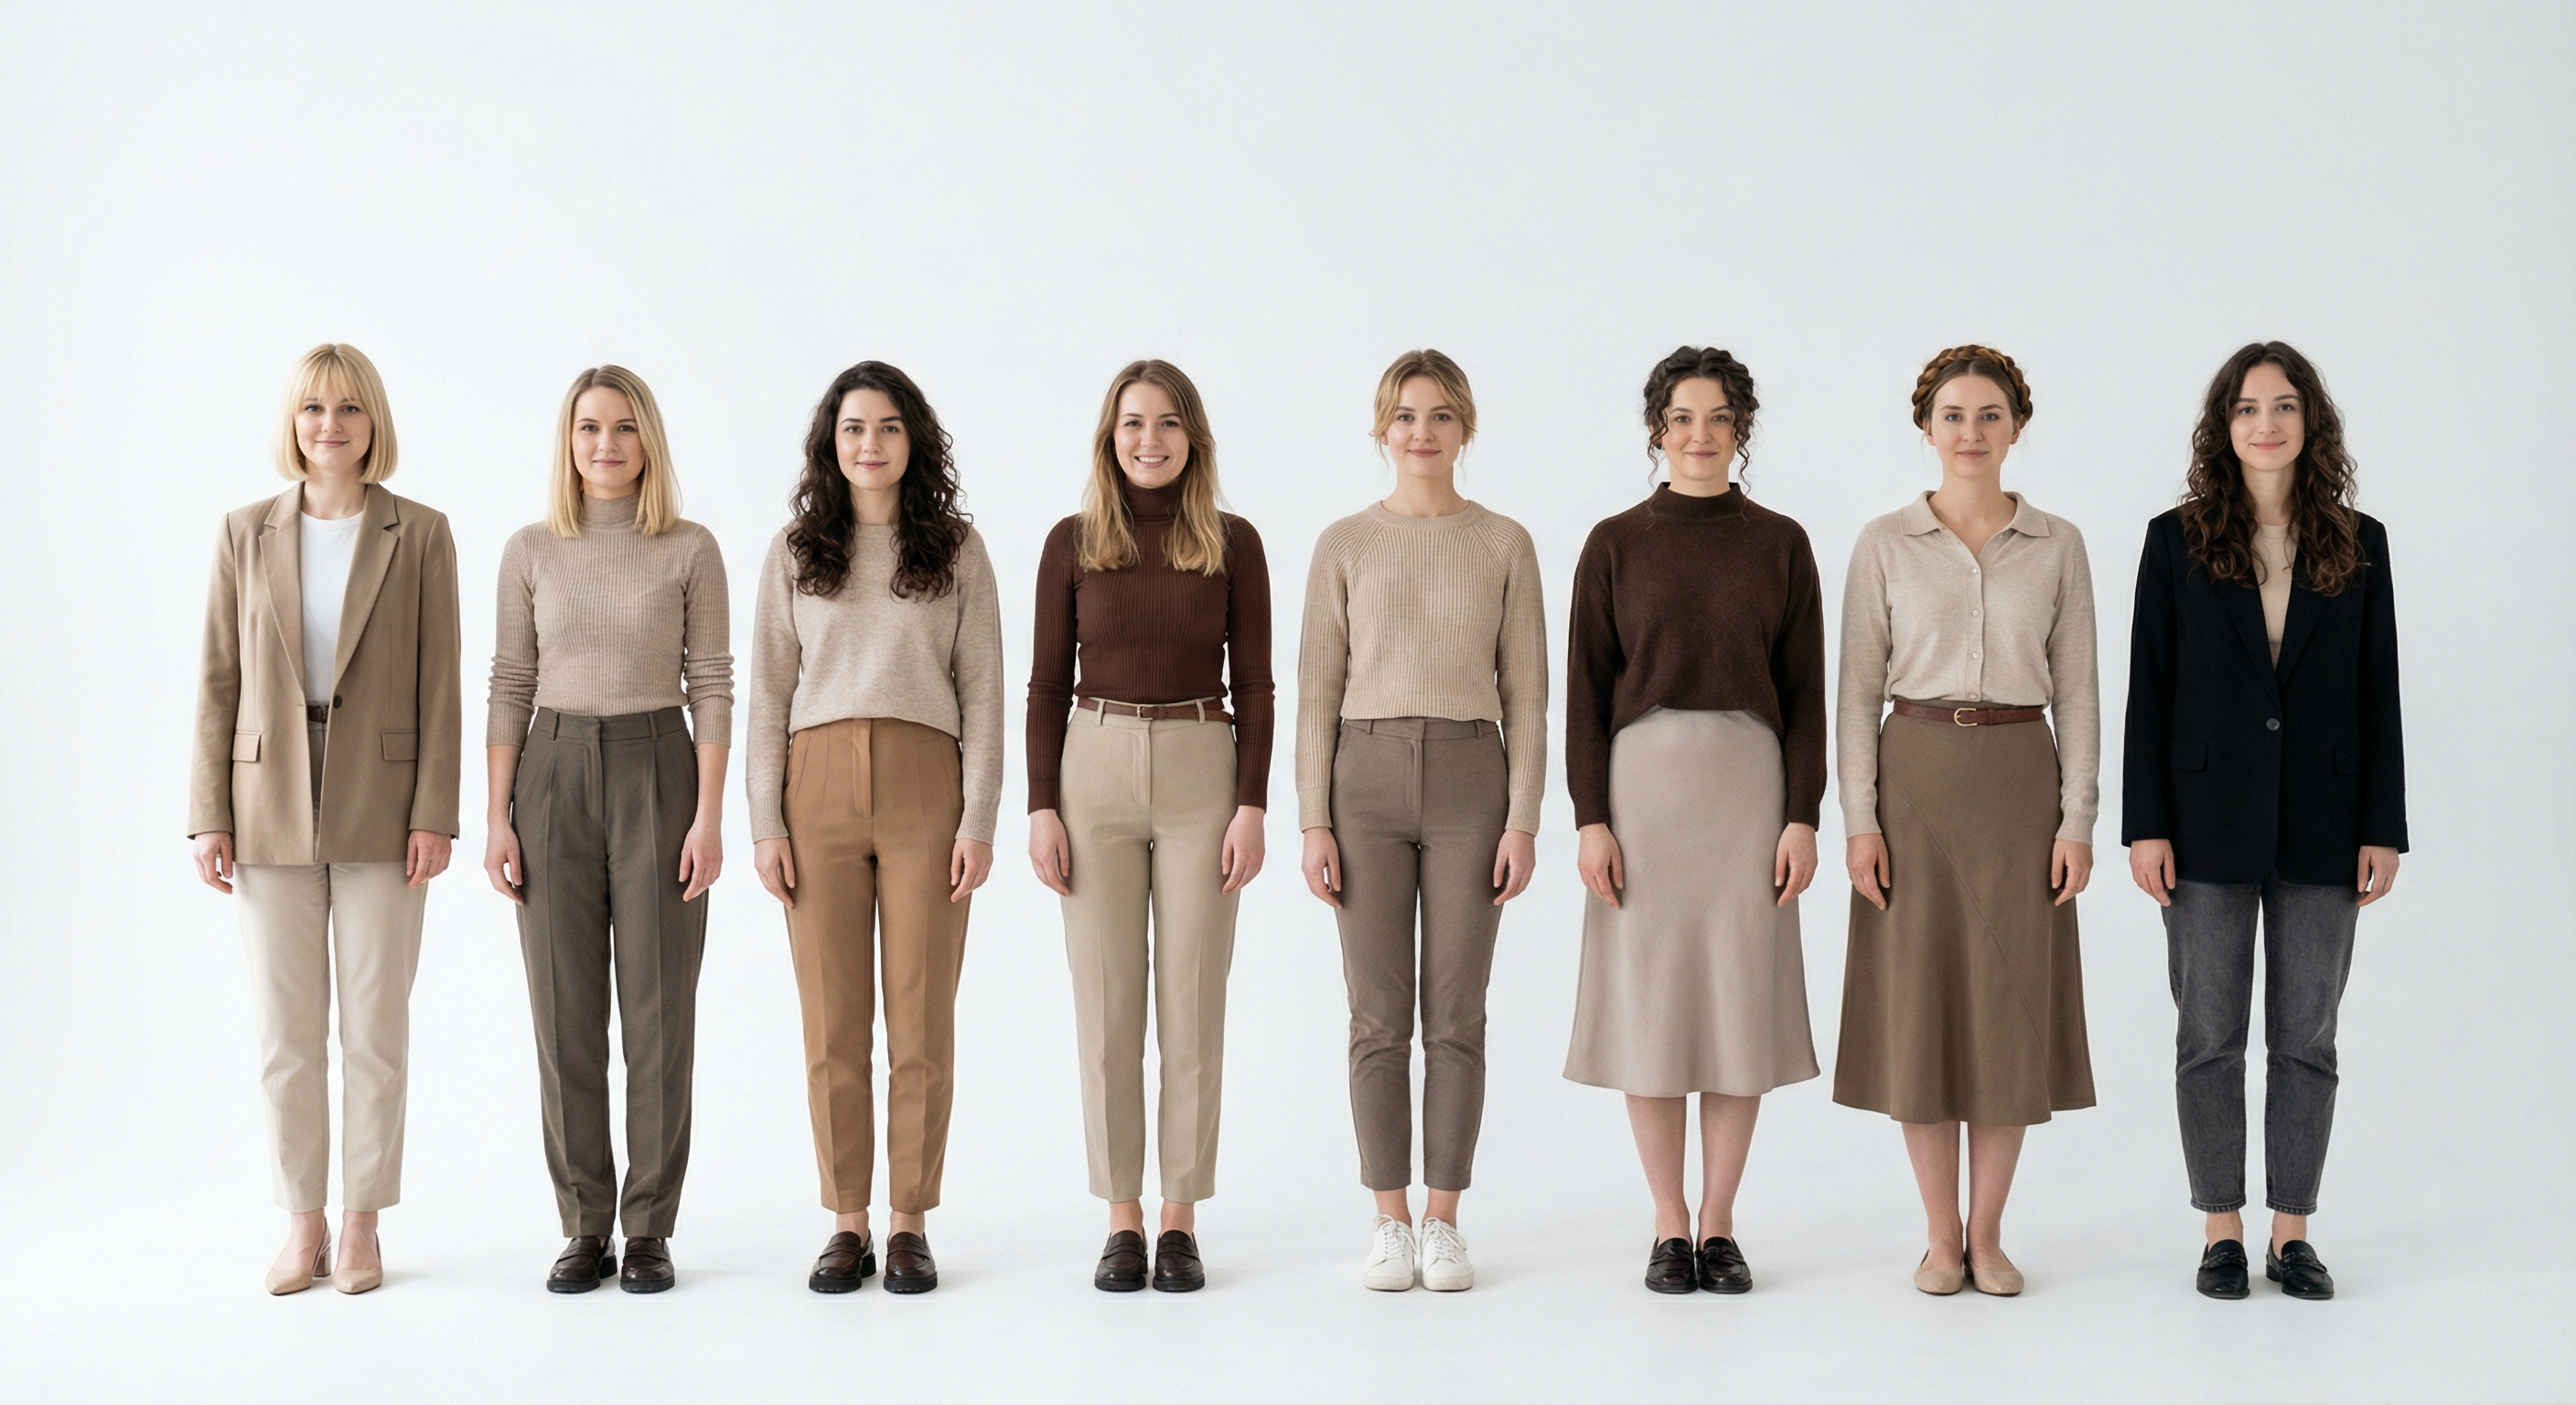
How Women Look
Typical look · 8 women, same format (AI generated)
Temperature Range
Peak Rainfall
71 mm/month
Best Months
AQI Reference Scale (US EPA Standard)
Gdansk
Baltic coast
Wroclaw
Nightlife hub
Warsaw
Capital
Krakow
Historic city — coal heating
Annual median AQI — IQAir / WHO data. Based on US EPA standard scale.
Internet: Median Fixed Broadband — Speedtest Global Index
Pros5
- Beautiful women.
- Kraków and Warsaw are affordable European cities.
- Women are often attractive; many speak some English.
Cons4
- The scene is "cooked." Women are highly Westernized, entitled, and act just like American women now.
- Colder culture; approachability lower than in Latin America or SEA.
- Less of a “passport bro” destination; more traditional dating.
Stats & Comparisons
Population · Economy · Physical · Society — switch tabs to explore
% of total population per age group · UN WPP
Ratio: more ♀ than ♂ in an age group is favorable; more ♂ than ♀ is unfavorable (severity shown).
Best & worst cities (20–39 prime age)
Cities with the best and worst female-to-male ratio in the prime dating window (ages 20–39). More women = larger dating pool and better competitive edge. Map: circle size = population; color = ratio.
Cities (20–39 prime age) · ratio & population
UN WPPRatio from country demographics (UN WPP) + city type. Population: UN / national statistics.
All cities (6) — sorted by ratio (best first)
Best: Kraków (108 ♀/100♂)Worst: Katowice (92 ♀/100♂)